Why Amazon Price History Matters
Amazon prices change constantly. According to Profitero's analysis, Amazon adjusts prices on millions of products up to 2.5 million times daily. That's roughly 8% of their entire catalog experiencing price fluctuations every single day.
Understanding price history helps you:
- Identify whether a "deal" is actually a good price
- Spot fake discounts during Prime Day or Black Friday
- Time your purchases for predictable price dips
- Avoid buying at artificial price peaks
But here's the problem: different tools show different time windows, and each has significant limitations. Let's break down what 30-day vs 90-day price history actually tells you, and more importantly, what it doesn't.
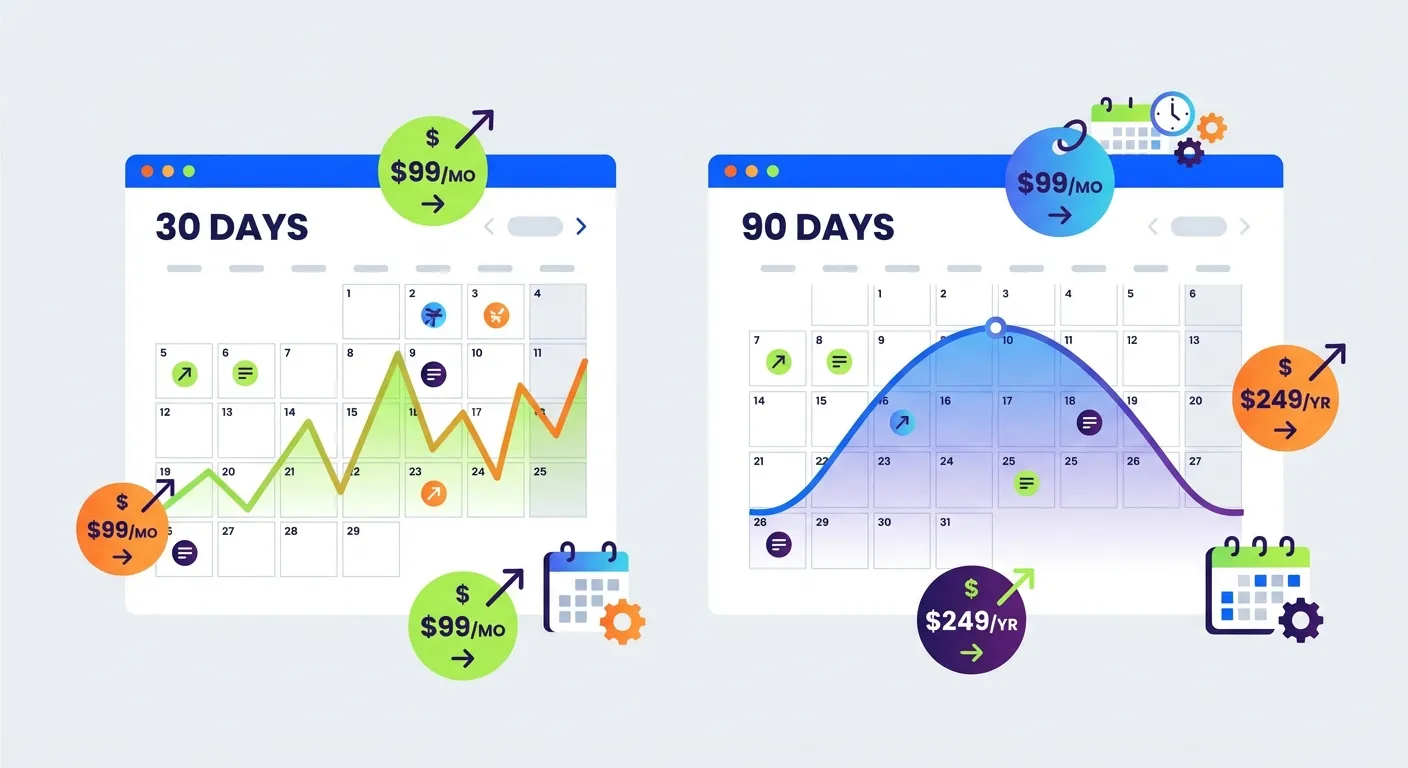
Amazon's Native Price History: The 30-Day Window
Amazon has been quietly rolling out a built-in "Price History" feature on product pages. According to 4seller's analysis, this feature appears beneath the list price on mobile and shows 30 to 90 days of price history.
You've probably seen Amazon's "Lowest Price in 30 Days" messaging. This badge means the current price is at or below the lowest featured offer price for that item in the past 30 days. While helpful, this window has serious limitations:
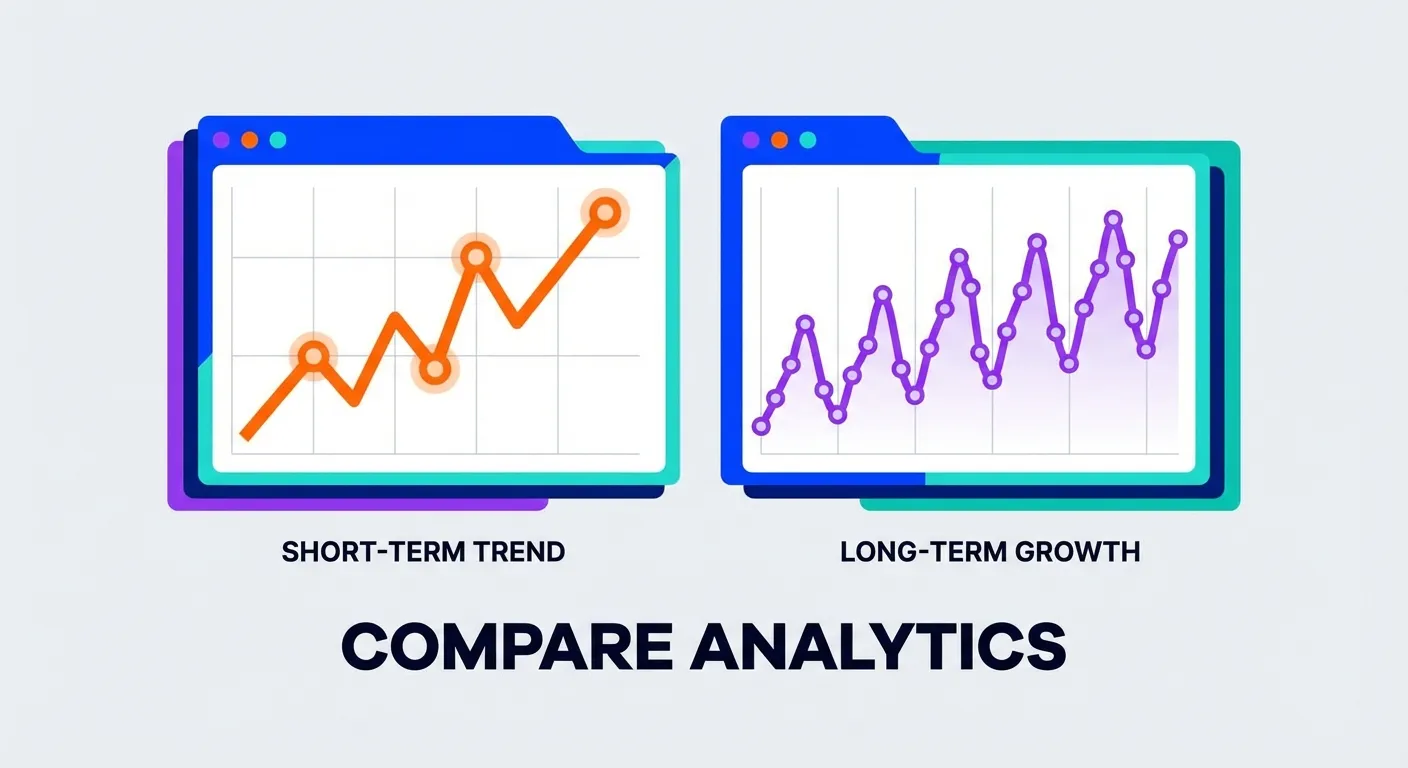
What 30 Days Shows You
- Recent price volatility and short-term trends
- Whether a current discount is genuine or inflated
- Quick price changes around flash sales or deals
What 30 Days Misses
- Seasonal pricing patterns (holiday drops, back-to-school sales)
- Long-term price trajectory (is this product getting cheaper over time?)
- Historical lows from previous major sales events
- Artificial price inflation before big sales (common before Prime Day)
The 90-Day View: Better, But Still Limited
A 90-day price history window gives you significantly more context. You can see roughly a full quarter of pricing behavior, which typically includes at least one major sales event or seasonal shift.
What 90 Days Shows You
- Pre-sale price inflation tactics
- Recovery patterns after big sales
- Monthly pricing cycles some sellers use
- More accurate "lowest price" comparisons
However, 90 days still misses year-over-year patterns. A product that drops 40% every Black Friday won't show that pattern in a 90-day view if you're looking in March.
Third-Party Tool Comparison: How Much History Do You Actually Get?
Different price tracking tools offer vastly different history windows. Here's what you can expect:
| Tool | Free History | Paid History | Update Frequency |
|---|---|---|---|
| Amazon Native | 30-90 days | N/A | Real-time |
| Amazon Assistant | 30 days | N/A | Real-time |
| Honey | 30 days (default) | 120 days max | Daily |
| Keepa (Free) | 90 days | Full history | Every 15 min |
| CamelCamelCamel | Full history | N/A (always free) | Hourly |
| TaskMonkey | 3 months of orders | Same | On-demand scan |
Keepa: Power User's Choice
According to Keepa's official site, they track over 2 billion Amazon products across multiple marketplaces. Free users get 90 days of history, while the premium subscription (about $20/month) unlocks the full historical dataset dating back years.
Keepa's charts show multiple price lines: Amazon's direct price, third-party new offers, and used prices. This granularity is extremely valuable for understanding the full pricing picture. Learn more in our complete Keepa extension guide.
CamelCamelCamel: Free Full History
CamelCamelCamel has been tracking Amazon prices since 2008, and they offer complete price history for free. Their data can show you how a product has performed over multiple years, multiple Prime Days, and multiple holiday seasons.
The trade-off? CamelCamelCamel tracks about 6 million products compared to Keepa's 4.5+ billion. If you're looking at a niche or newer product, Keepa might have data where CamelCamelCamel doesn't. For more details, see our Keepa vs CamelCamelCamel vs Honey comparison.
The Fundamental Problem: All These Tools Look Forward
Here's what every price history tool on the market misses: they're designed to help you buy smarter in the future, not recover money on purchases you've already made.
Think about your Amazon order history. How many items did you buy in the last three months? Now consider that Amazon changes prices constantly. Statistically, many of those items have dropped in price since you paid.

The Hidden Refund Opportunity
Amazon doesn't officially advertise a price adjustment policy. As Consumer Reports notes, you typically need to ask customer service directly. And while Amazon ended its formal price drop refund policy, agents can still issue courtesy credits on a case-by-case basis.
The problem? Who has time to:
- Go through every order from the last 3 months
- Check current prices against what you paid
- Calculate the difference
- Contact customer service for each eligible item
- Politely negotiate a refund
Most people don't. That's money left on the table.
TaskMonkey: Scanning Your Past, Not Just Your Future
This is where TaskMonkey takes a fundamentally different approach. Instead of tracking prices for items you might buy someday, we scan items you've already purchased.
Here's how it works:
- Install the free Chrome extension
- Click "Start Saving Now"
- TaskMonkey automatically scans your last 3 months of Amazon orders
- We compare what you paid vs. current prices
- For any price drops, AI automatically contacts Amazon customer service
- Credits and refunds go directly to your Amazon account
The 3-month window isn't arbitrary. It aligns with Amazon's return window policies and the timeframe where courtesy credits are most likely to be granted. We've successfully processed thousands of refund requests using this approach.
When to Use Each Tool
The smartest strategy combines multiple approaches:
For Future Purchases
- Use CamelCamelCamel for free, long-term price history
- Use Keepa for more detailed charts and faster updates
- Check Amazon's native 30-day low badge for quick validation
For Past Purchases
- Use TaskMonkey to scan your order history
- Let AI handle the negotiation automatically
- Collect refunds on items you've already bought
These tools complement each other. Price trackers help you pay less upfront. TaskMonkey helps you recover money after the fact.
Real Numbers: What 3 Months of Orders Typically Reveals
Based on our user data, the average Amazon customer who scans their 3-month order history discovers:
- 5-15 items with meaningful price drops
- $50-200+ in potential recoverable difference
- 90%+ success rate when politely requesting courtesy credits
The key phrase is "courtesy credits." Amazon's customer service has discretion to issue these, and they frequently do when approached correctly. TaskMonkey's AI is trained to make these requests in a polite, effective manner that maximizes approval rates.
Frequently Asked Questions
Is 30 days enough price history to spot fake discounts?
It depends. For everyday purchases, 30 days can catch recent inflation. But for big sales like Prime Day or Black Friday, sellers often raise prices 60-90 days in advance. A 30-day view won't catch that. For more on spotting fake discounts, see our guide on verifying deals with price trackers.
Why doesn't Amazon show longer price history?
Amazon benefits from urgency. Showing that an item was $20 cheaper last month doesn't encourage you to buy now. Their 30-day window is just enough to satisfy EU transparency requirements while keeping historical context limited.
Can I request a price adjustment on any Amazon purchase?
You can request on any item, but success varies. Items purchased within the last 7-30 days have the highest success rate. Beyond that, courtesy credits become less common but still possible, especially with polite, persistent requests.
How is TaskMonkey different from setting price alerts?
Price alerts tell you when something drops. TaskMonkey works on items you've already bought. If you purchased a TV last month and it dropped $80 today, a price alert does nothing for you. TaskMonkey would detect that drop and try to get your money back.
The Bottom Line
Understanding Amazon's price history windows is valuable, but don't get lost in the data. The real question isn't "what will this cost in the future?" but "am I leaving money on the table from purchases I've already made?"
For forward-looking research, CamelCamelCamel and Keepa remain excellent tools. But for actually recovering money, you need something that looks backward at your order history, not forward at hypothetical purchases.
TaskMonkey scans 3 months of your Amazon orders, compares prices, and uses AI to request refunds automatically. We only charge when we successfully get money back for you, 20% of what we recover. If we don't save you anything, you pay nothing.
Stop leaving money on the table. Your past purchases deserve attention too.
Related Articles in This Topic
- Amazon Price Tracker (2026): Track Price Drops, See Price History & Get Alerts
- Amazon Price Tracker Extension: Best Chrome Extensions + Setup Guide
- Amazon Price History Extension: How to See Price Charts on Every Product Page
- Keepa Extension: What It Is, How It Works, and Best Settings
- Keepa vs CamelCamelCamel vs Honey: Which Amazon Price Tracker Should You Use?
- Track Price Drops After You Buy: Can You Get Money Back From Amazon?
- How to Read a Keepa Chart: Price, Sales Rank, and Deal Traps
- How to Set Amazon Deal Alerts (Wish List, Rufus, Alexa+): 2026
- Prime Day / Black Friday "Fake Discounts": How to Verify With Price Trackers
- Best Amazon Price Tracker App (2026): Top Picks Compared